

Airplane Trajectory
This project was undertaken as an investigation into a interesting question I came across when I started a new work position. My workplace was located very close to Toronto Pearson International Airport, and each day I would see and hear several airplanes flying overhead.
I was curious how close to me the airplanes got on their takeoff path, and so I took it upon myself to model using MATLAB the first few seconds of the trajectory of a typical aircraft taking off from Pearson Airport to solve this problem.
Before I could successfully model an airplane's takeoff path, I had to research several topics: takeoff speeds of an airplane, angle of climb during takeoff, and the types of planes that took off from Pearson.
I quickly learned that takeoff is a precise process with many different V-speeds to designate speed checkpoints that pilots must achieve during takeoff to ensure that the takeoff is successful.
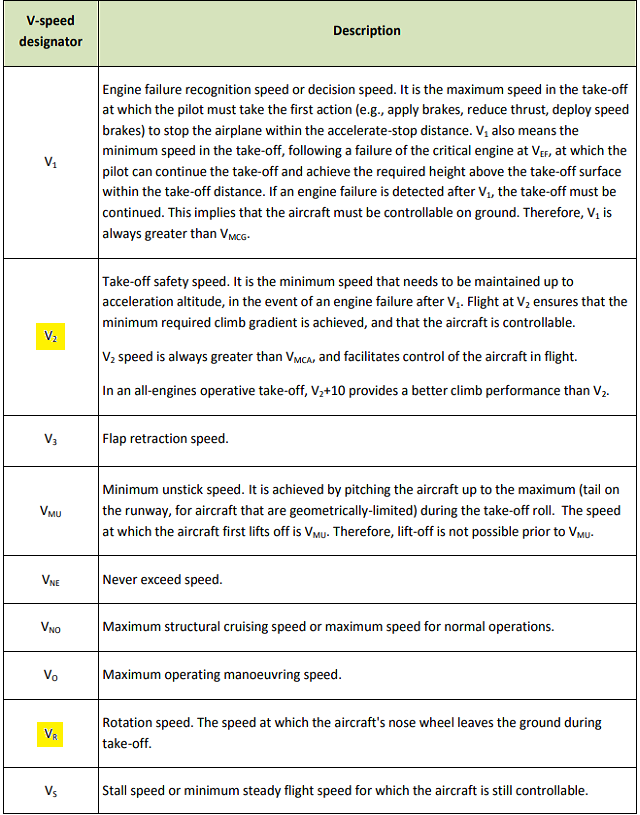
There are two V-speeds that are particularly important to this project: Vr — the speed at which the pilot begins to rotate the plane to leave the runway and V2 — the minimum speed at which controlled climb is possible, where V2 is reached after Vr, and V2 > Vr due to the acceleration of the plane. Another important consideration for an airplane's takeoff trajectory is that the aircraft must be at least 35 ft (10.7m) off the ground at the end of the runway, as required by the FAA.
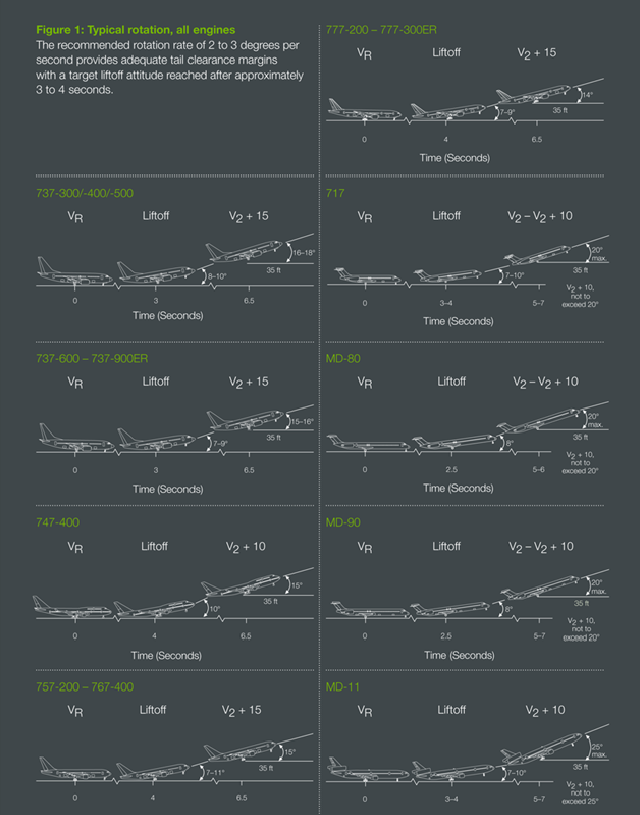
Next, I had to determine the angle of climb of typical aircraft, and I found that different aircraft have different angles of climb. The pamphlet on the right by Boeing shows the typical range of climb angles for their commercial aircraft.
Given the large variance in the liftoff and climb angles, I thought it best to single out one model of aircraft from the chart and derive the takeoff trajectory using that information. To determine which airplane to model, I looked for one that would most likely be present at Toronto Pearson International Airport.
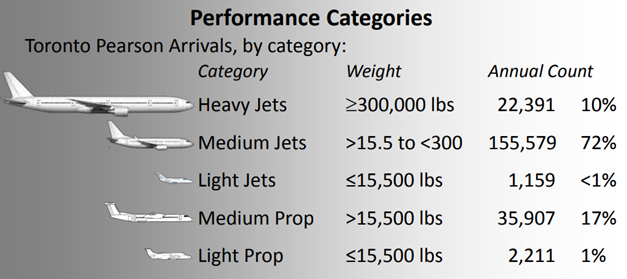
Since the overwhelming majority of planes that take off and land from Pearson are medium sized jets, airplanes in this category were the most logical candidates and so heavies such as the 747 and 777 were excluded. I settled on the Boeing 737 (737-300 more specifically), as this series of airplane fit snugly in the weight category and is the most produced commercial jetliner in the world.
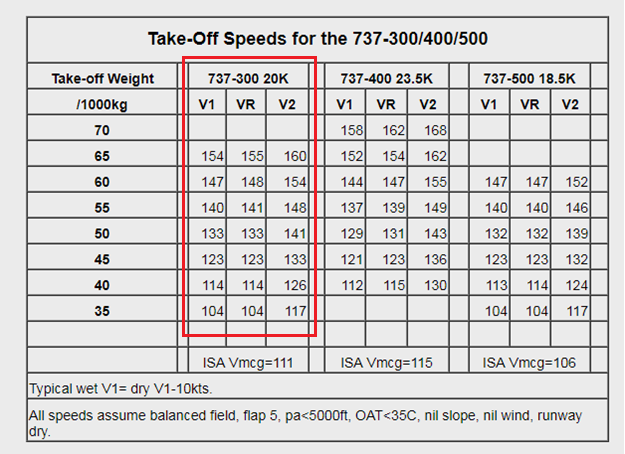
Given the takeoff information and V-speeds of a Boeing 737-300, I had enough information to begin plotting the path of this plane's takeoff. But first, I had to make one small consideration. V-speeds are not set in stone for any airplane, but are dependent on a variety of factors listed on the bottom of the chart (right).
The most important factor is the takeoff weight of the jet, as this will significantly change the V-speeds. To deal with this, I fit a linear relationship between weight and Vr so that when the takeoff weight is entered, the corresponding Vr value is calculated automatically and converted to m/s.
To ensure that the flight path is modelled accurately, the motion of the plane must be considered as well as its position. I applied Newton's 2nd law and kinematics to solve the physics on takeoff. The forces on an airplane are thrust, drag, lift, and gravity. For the airplane to move forward during take off, thrust must exceed the relatively high lift-induced drag.
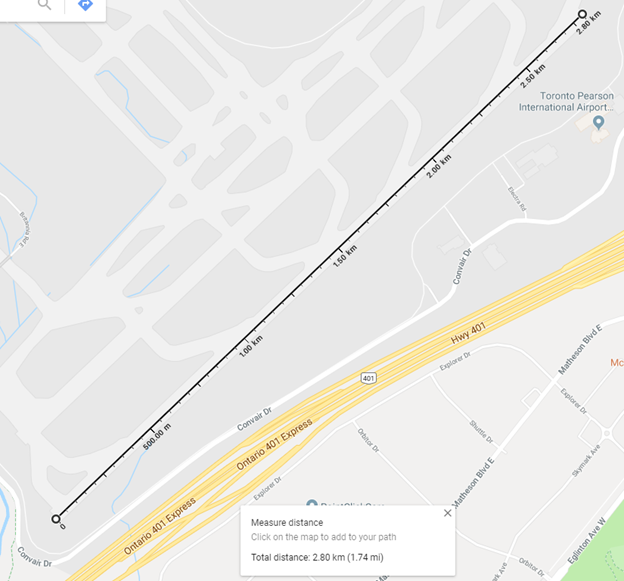
The Boeing 737-300 has 2 CFM Intl CFM56-3B2 engines, each capable of providing 97.9 kN of thrust. This jet has a maximum tow weight of 63000 kg, and using the equation F = ma and counting for drag, the acceleration comes out to be around 1.6 m/s2, consistent with actual acceleration values. Using this acceleration and kinematics, I was able to determine the minimum runway distance required for the jet to reach the required V-speeds.
To model the airplane's flight path, I used Google Maps to locate and orient the runway and my position from which to calculate the minimum distance of the flight.
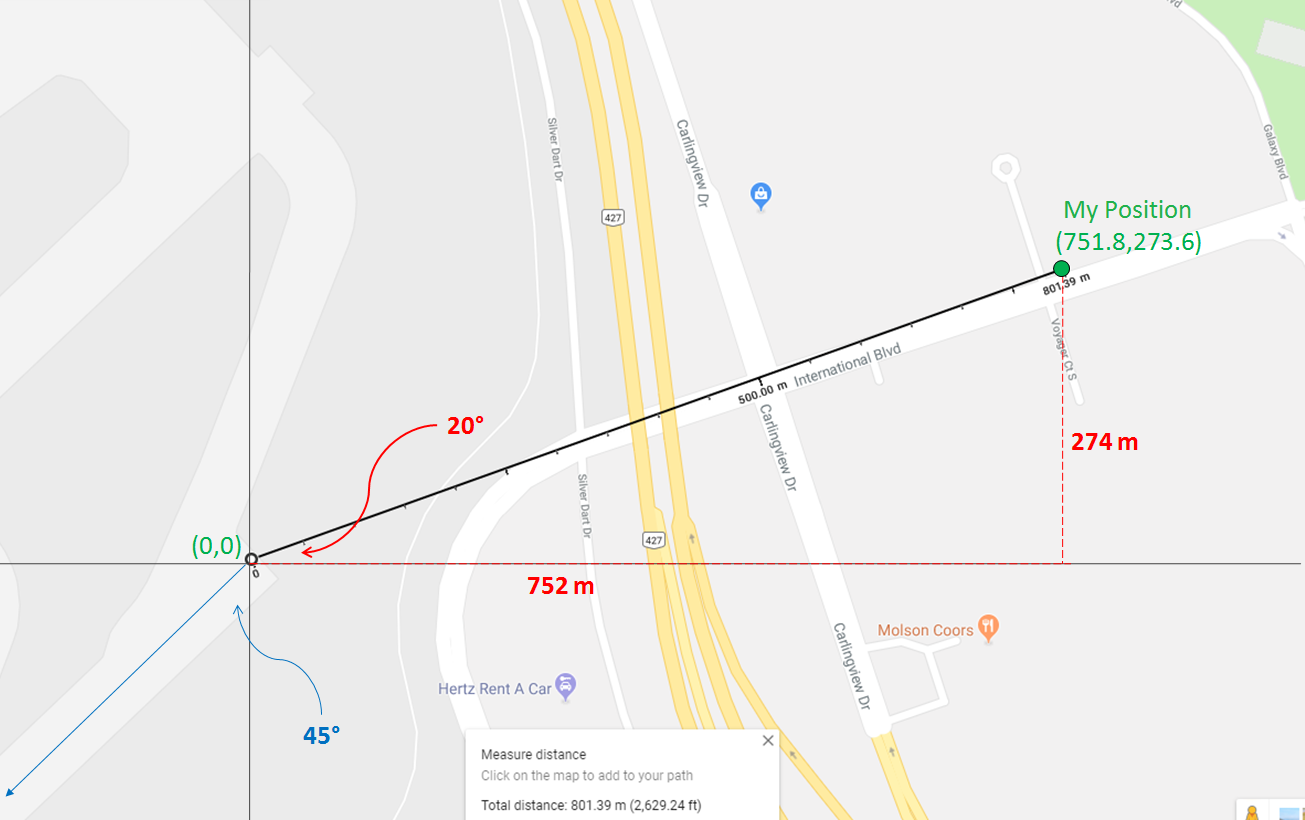
I chose the end of the runway as the origin to have an easy reference to my position and so that the required flight clear point 35ft above the end of the runway could be referenced as (0,0,10.7)
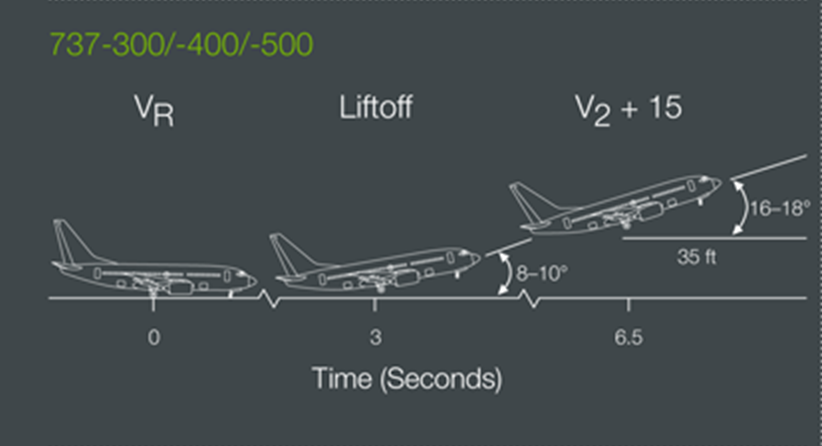
It would be easy to model the constant climb vector, but modelling the path of the airplane from the runway to the point of constant climb proved more difficult than I expected. From the Boeing pamphlet, I determined the following information: the plane only leaves the ground 3 seconds after Vr is reached, the plane has rotated 9° 3 seconds after Vr, the plane reaches a climb angle of 17° 6.5 seconds after Vr is reached, which leads to the derivation that the climb angle increases by ~2.29°/s (16/7 °/s). I reasoned that the slope at each point during takeoff was equal to the tan of the angle:
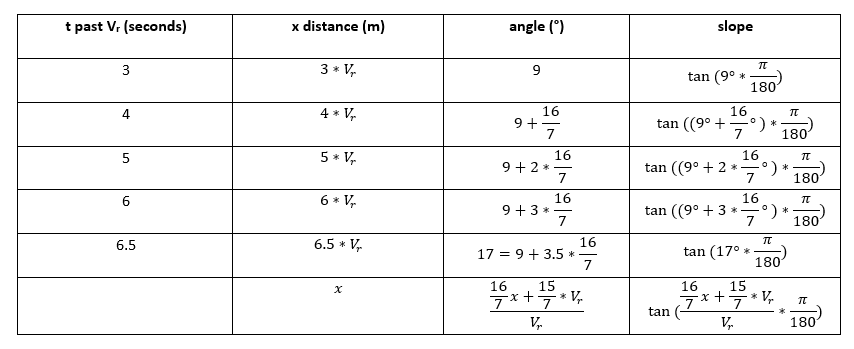
The above chart shows the relationship between time, horizontal distance, angle, and slope with the angle measured in radians. The last line shows the climb angle and slope as a function of horizontal distance. This generalized equation for slope can be integrated to give the function that is the path of the takeoff from runway to constant climb point. x is changed to x+6.5*Vr to shift the curve to the left to make sure the final point, where the angle is 17°, lands on x = 0, or the y-axis.
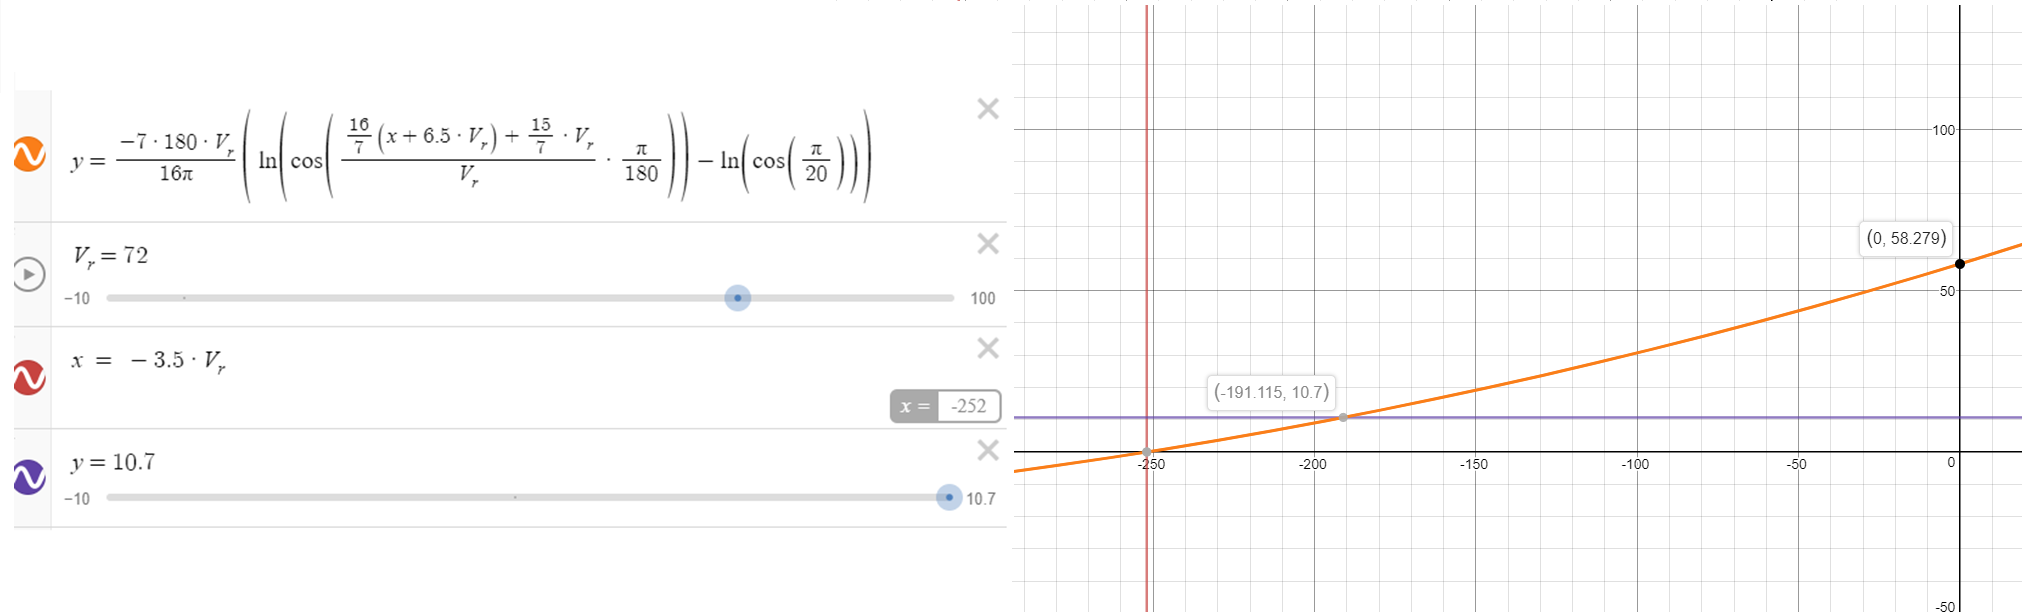
This model shows that the clear altitude of 35 ft (10.7m) is reached at approximately 3.8 seconds after Vr is reached: $$\frac{6.5*V_r-191.115}{V_r}=3.8456$$ This agrees with the information from the Boeing pamphlet, which expects "target liftoff attitude reached after approximately 3 to 4 seconds".
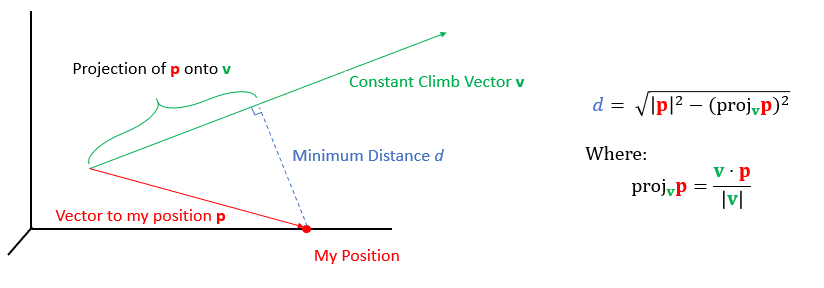
After the takeoff curve, a vector tangent to the end to the curve was used to model the constant climb portion of the airplane's takeoff. With these two curves and the appropriate length of runway necessary calculated earlier, the flight path modelling was complete, and my next task was to use this information to calculate the minimum distance from the takeoff path to my position.
To accomplish this I used my knowledge of linear algebra and projections.
I used MATLAB to put together all the calculations and model the entirety of this project:
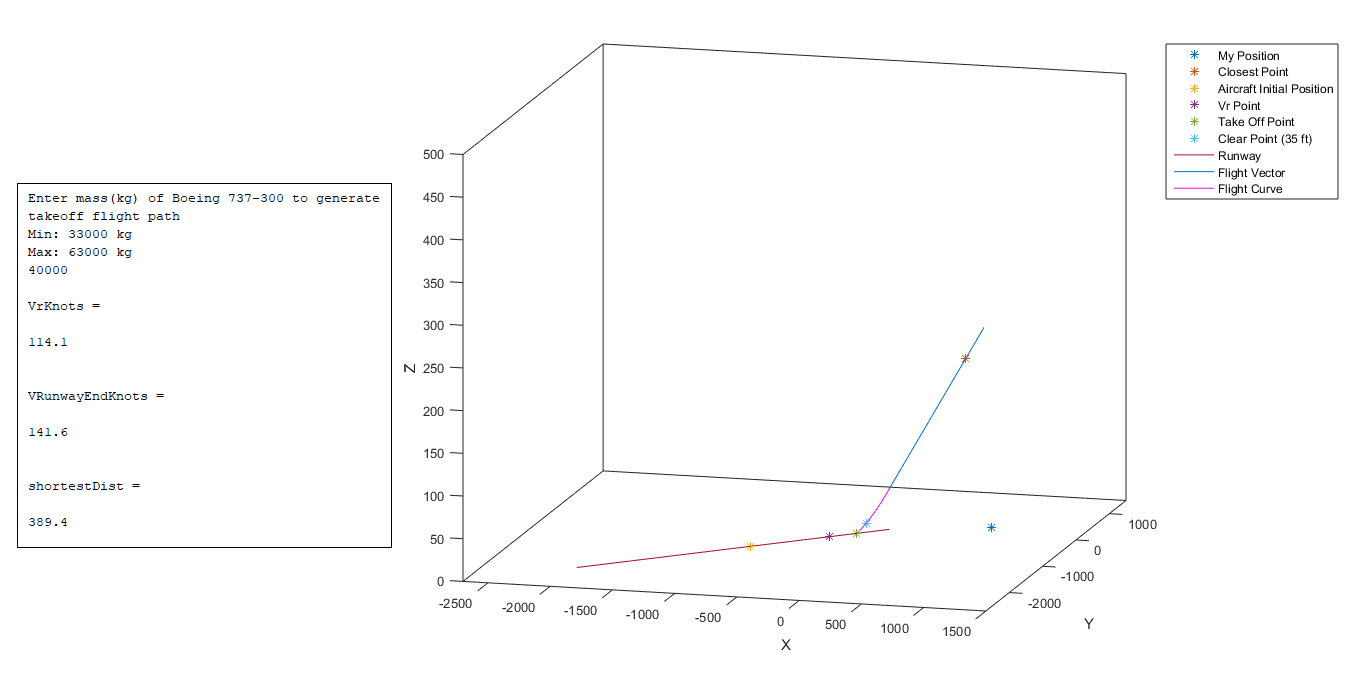
The closest point appears to be quite far from the point representing my position, but this is due to the scaling of the Z-axis. However, this view allows all the points, vectors, and curves to be seen clearly.
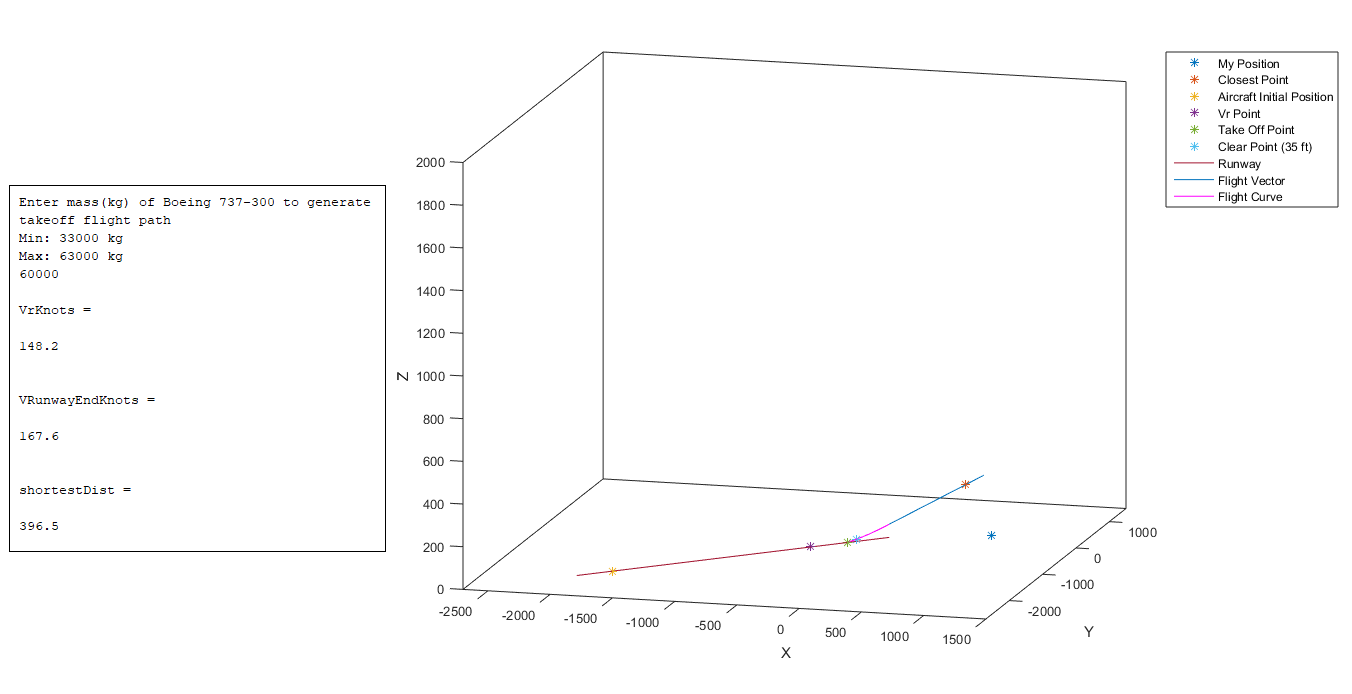
This is a more realistic scaling of the true takeoff trajectory of a Boeing 737. In each of these differing weights, the Vr and runway end speed values are consistent with the values provided earlier. The Boeing pamphlet determined that at end of the runway the speed would be V2 + 15 knots, and this is the value predicted by the model within a small margin of error, for all takeoff weights. This independently corroborates the model and helps ensure its accuracy. The minimum distance was found to be around 390 m, varying slightly with the mass and speed of the aircraft.
Using my knowledge of calculus, linear algebra, physics, and MATLAB, I was able to accurately model the takeoff flight path of a typical airplane flying from Pearson International Airport and determine the minimum distance from the flight path to any observer on the ground.